Guides
IVF Success Rates CDC 2021 Report - What's changed since the previous year
IVF Success Rates by age in the United States for the newest CDC data released 2021
The Centers for Disease Control (CDC) regularly collects IVF clinical outcome data from hundreds of fertility clinics across the United States and makes it publicly available. This data is reported annually detailing success rates for each participating fertility clinic individually and in aggregate as the national average.
The 2021 reporting year has just released the most up-to-date data on assisted reproductive technology (ART) to show national IVF outcomes for the year 2019.
Why does the most current IVF data report on 2 years prior?
The most up-to-date success rates are always from 2 years prior, so the report released in 2021 is for the IVF cycles that initiated during 2019.
This lag time in reporting allows the report to not only include IVF statistics such as number of cycles started, number of transfers, and diagnoses but also whether a live birth occurred from each cycle.
So it takes the better part of a year to wait for birth outcomes alone and then there’s the collection of the data by the fertility clinics, submission to the CDC, and CDC analysis and data preparation as well.
Looking for an in-depth breakdown of the newest IVF Success Rate Data?
The current article you are reading is about what the CDC has changed about their IVF reporting for 2021.
If you're more interested in what your chances of success are with IVF based on the 2021 data, we have a more informative article for you!
Check out our article on IVF Success Rates by Age in 2021.
In our IVF Success Rates Article, we break down the newest CDC data into charts to show you:
👉IVF success rates by age for all cycles
👉Success rates for all new patients doing their first ever IVF cycle
👉Embryo transfer success rates by age
👉Donor egg IVF success rates (fresh eggs vs frozen eggs)
Now, to continue with what's changed on the IVF CDC repots for this year.
What's changed for the newest IVF Success Rate data?
Female age categories
The most notable change in how the data was aggregated from 2018 to 2019 is a change in the age categories used to aggregate clinical outcomes.
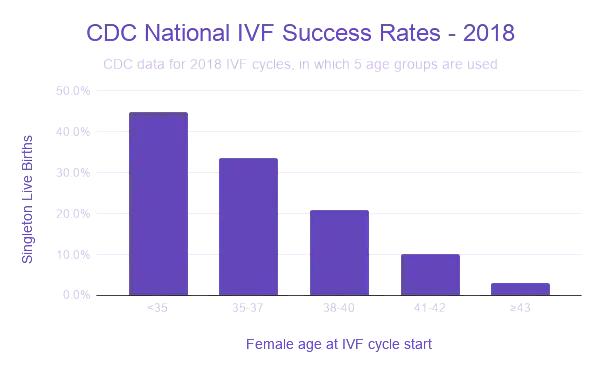
In 2018, the CDC reported success rates for IVF stratified by 5 different categories for female age:
- <35
- 35-37
- 38-40
- 41-42
- >42
In this article, we will be showing the information for percent of singleton live births for all intended egg retrievals that occurred for the year.
This is the most realistic metric to use as it includes all cycles started with the intent of retrieving eggs, so it also includes any cycles that were cancelled prior to the retrieval or cycles that failed to retrieve eggs, which can happen to some patients. In 2019, 8.7% of all IVF attempts resulted in a failure to retrieve any eggs.
The data we will look at in this article does not include twin or triplet births as this can artificially inflate the success rates and in addition to this, a singleton live birth is considered the optimal outcome from an IVF cycle, as multiple gestations have higher maternal and fetal risks associated. The goal is a single, healthy baby.
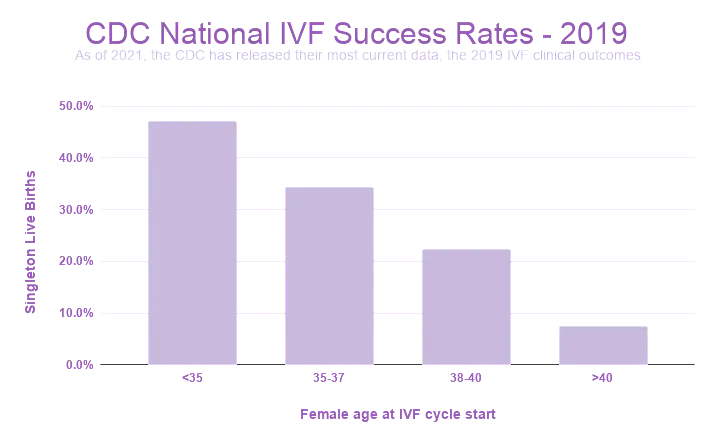
For the newest data, which reports on IVF cycles that initiated in 2019, we’ve lost a bit of granularity. In this most recent report, the last two age categories previously used (‘41-42’ and ‘>42’) have been merged to represent women ‘>40’ undergoing IVF as the final age category in the dataset.
2019 CDC IVF data has 4 age categories:
- <35
- 35-37
- 38-40
- >40
While a reduction in granularity for clinical outcomes was the most noticeable change in this year’s reporting, there was also a reduction of one categorical variable which is important to note.
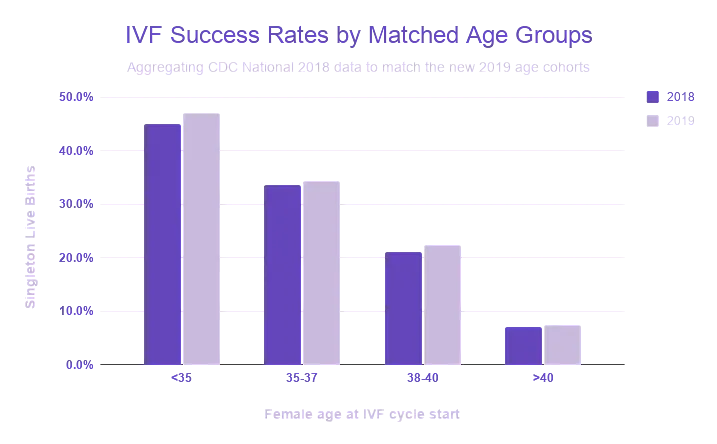
This will make some of our year over year data difficult to show as the aggregations are different. However, there are certain instances in which the CDC reports contain enough information on the n for its measurements to recalculate the data from the previous year in order to show a more clear comparison of the 2018 vs 2019 data.
IVF Success Rates by Age
Here, we’ve re-aggregated the 2018 columns to show an age-matched comparison of the 2018 vs 2019 national outcomes for singleton live births resulting from all intended retrievals.
However, this isn’t possible with the information provided for all cases. For example, data on the percentage of transfer cycles that utilized ICSI will have to be shown using the age categories assigned in each reporting year.
Fertility clinic services offered
Along with clinical outcomes for IVF, fertility clinics report whether they offer specific infertility services, such as a donor egg program, donated embryo program, gestational carrier program, etc.
There is one such service offering, which has always been reported over the past 24 years since the first available CDC report in 1995: the ‘Single Women Service’ column.
This is a fairly outdated data point but had survived until last year’s report of 2018 clinical outcomes. The column ‘Single Women Service’ takes a boolean value confirming whether a clinic provided services to single women as patients.
The CDC puts in their description for 2018 outcomes, “Clinics have varying policies regarding ART services for unmarried patients—for example, single women.”
Virtually all clinics in this day in age (99% in 2018) offer services to single women which encompass many different scenarios such as single parents by choice, egg freezing, and same-sex couples who may in the past have represented themselves as single for cultural or privacy reasons, so the need to indicate whether clinics offer this service is now unnecessary.
The removal of reporting on this service for 2019 has not been specified by the CDC but is likely for reasons which I can only assume are in keeping with the modern day use of fertility clinics.
Number of IVF cycles & the use of PGT-A increased in 2019
Here’s a basic overview of the differences we found meaningful or interesting when looking at the 2019 report versus the previous year.
Changes in CDC National ART Data - 2018 vs 2019
Interestingly, while the number of clinics reporting has decreased slightly, the total number of cycles in aggregate has increased about 8% since the previous year and up 16% over the past two years.
The number of fertility clinics present in the United States showed a slight decrease between 2018 and 2019, however, no one state gained or lost more than 2 clinics since the previous year.
Although negligible, there was a noticeable pattern of clinics being added on the West Coast and a small reduction of clinics peppered the East Coast and Midwest.
🕵️♀️ Ready to start looking for a fertility clinic? Head to our clinic search to compare options in your area & learn more about each provider & their IVF success rates.
PGT Utilization has Increased
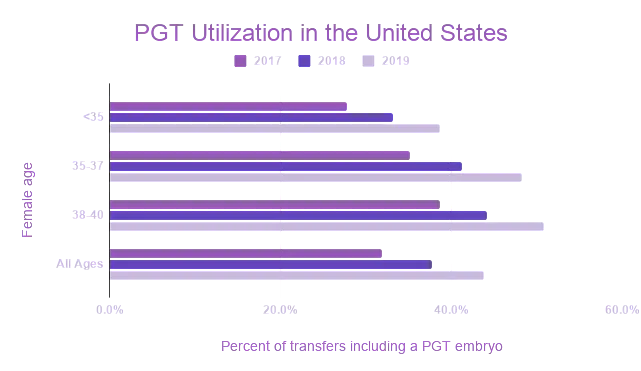
Another interesting yet unsurprising trend is that the transfer of embryos tested by PGT-A has increased 6% in just a year while the use of ICSI has remained relatively constant. Recent studies have shown that the use of PGT-A can increase the chances of a successful cycle as well as help reduce time to pregnancy when in treatment.
It’s possible that these recent studies on the test’s influence on success rates as well as testing accessibility could be influencing decisions on the physician and patient side to elect for preimplantation genetic testing more than before. However, we can’t be certain what the cause is.
As we can see when comparing the past 3 years of CDC data, the percent of transfer cycles that contain at least one embryo evaluated by preimplantation genetic testing has increased.
In 2019, we see that 51% of embryo transfer cycles for women aged 38-40 contained an embryo that had been tested by PGT.
Preimplantation genetic testing is increasingly offered to women of advanced maternal age as it is well established that as age increases, oocyte quality decreases, leading to embryos that are chromosomally abnormal.
It seems that while the use of PGT is increasing, fertility clinics are reporting an increase in the primary reason for a patient undergoing IVF being for the purpose of conducting preimplantation genetic testing.
The primary reason for a patient undergoing IVF is often due to a diagnosis of infertility, the most common being male factor, diminished ovarian reserve, or ovulatory dysfunction.
However, the need to genetically test embryos as the primary reason for using assisted reproductive technologies is on the rise.
In the reporting of this reason for undergoing IVF, the purpose of the PGT was included as either being to screen for chromosomal abnormalities (PGT-A) or to prevent an inherited disease (PGT-M).
This attestation of using IVF primarily for the purposes of PGT has grown from 11% of cycles in 2017 to 15% in 2019.
How we will use the newest IVF Success Rate Data to keep our users informed
At FertilitySpace, we always strive to show the most up-to-date complete data for each fertility clinic profile so that patients have the best information when comparing clinics.
We are currently in the process of updating our database of over 600+ fertility clinics across the US to replace the 2018 success rate data with the new 2019 information.
However, it’s important to keep in mind that this is the preliminary 2019 data released by the CDC and certain clinics in the report do not yet have complete data.
Soon when you use our fertility clinic search tool to find & compare clinics in your area, you’ll be able to see the 2019 data on a clinic profile. For clinics that have not completed their reporting, the 2018 data will still be available.
🕵️♀️ Ready to start looking for a fertility clinic? Search our national directory of fertility clinics to compare options in your area & view each clinic's IVF success rates.
